A Guide for Tech Enthusiasts
Introduction
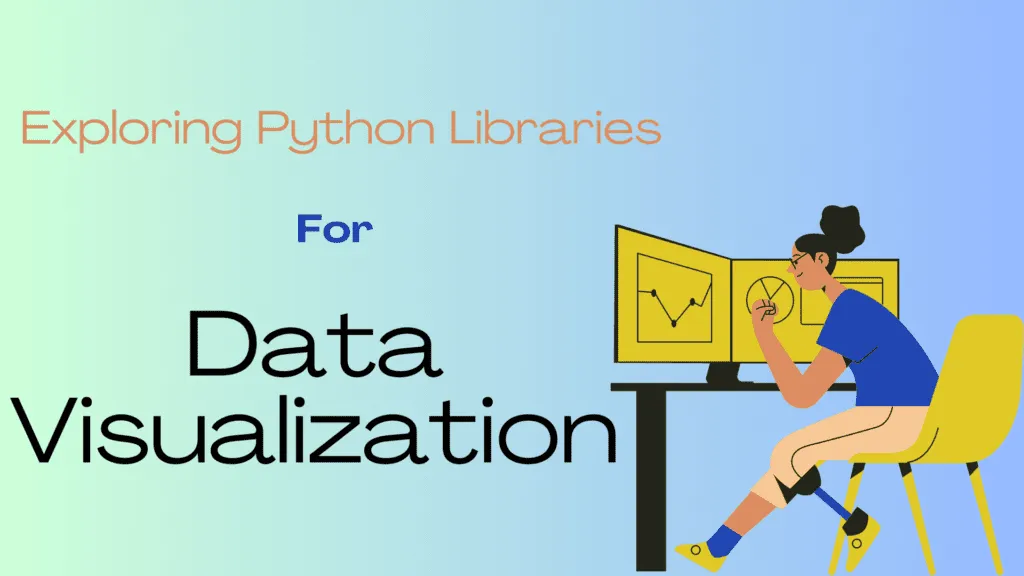
Python libraries for data visualization play a crucial role in the tech industry today. These libraries help tech enthusiasts to present complex data in an engaging and understandable way. Python libraries like Matplotlib, Seaborn, Plotly, and Bokeh provide comprehensive tools for creating rich visualizations. Good data visualization can make a huge difference in the way people understand the data. Therefore, understanding data visualization and the right libraries for the same will help tech enthusiasts develop their skills in the industry. So let’s delve deep and explore these libraries to create compelling data visualizations.
Matplotlib
Matplotlib: Matplotlib is the most commonly used Python data visualization library that helps to create static, animated, and interactive visualizations in Python. It provides a broad range of functionalities and customization options to make data visualization easier. For basic plotting techniques, Matplotlib offers features like line plots, bar plots, scatter plots, histograms, and pie charts. With advanced plotting techniques, it becomes possible to create subplots, heat maps, contour plots, polar plots, and 3D plots. Matplotlib’s flexibility and compatibility with other data visualization libraries make it a go-to choice for many data scientists and analysts.

Seaborn
Seaborn is a Python data visualization library that is built on top of matplotlib. It provides an aesthetically pleasing look to data visualizations without compromising efficiency. One of the main advantages of using Seaborn is its ability to create complex visualizations with just a few lines of code. Seaborn’s basic plotting techniques, such as scatterplots, bar plots, and histograms, are easy to use and produce visually appealing results. Additionally, Seaborn also offers advanced plotting techniques such as heatmaps, cluster map, and distribution plots which are useful when working with large datasets. In summary, Seaborn is an excellent choice for those looking to create visually stunning plots with minimal effort. Its vast array of basic and advanced plotting techniques makes it a great tool for both beginners and experts in data visualization.
Plotly
Plotly is a highly interactive library that allows us to create visually appealing graphs. Its benefits include the ability to create interactive charts, graphs, and dashboards. Moreover, its sleek design is ideal for data presentation in the tech industry. Using Plotly, we can easily understand and interpret complex data sets. Its dynamic features allow us to zoom in and out of the data, pan, and click on displayed plots to view underlying values. In a tech-driven industry, such features allow us to make informed decisions quickly and efficiently.
Bokeh
Bokeh is a powerful and interactive Python library designed to create visualizations in modern web browsers. It offers a unique set of features, like the ability to create complex visualizations with ease, and a range of output formats, including static files and server-driven visualizations. Bokeh also offers advanced streaming and real-time data analysis capabilities, perfect for data-driven applications. With Bokeh, you can create beautiful and interactive visualizations of both static and streaming data, with little to no coding expertise required. It’s definitely worth checking out for those looking to take their data visualization game to the next level.
Conclusion
Let’s quickly recap the key takeaways from this guide on exploring Python libraries for data visualization in the tech industry. We covered Matplotlib, Seaborn, Plotly, and Bokeh – each with its own advantages and unique features. When choosing the right library for your needs, consider factors such as your data type, visualization requirements, and level of interactivity. Keep in mind that the key to effective data visualization is selecting the right tool for the job. Happy data exploring!